CODESYS helps you to configure your RevPi AIO.
- In the CODESYS tree, double-click on the RevPi AIO.
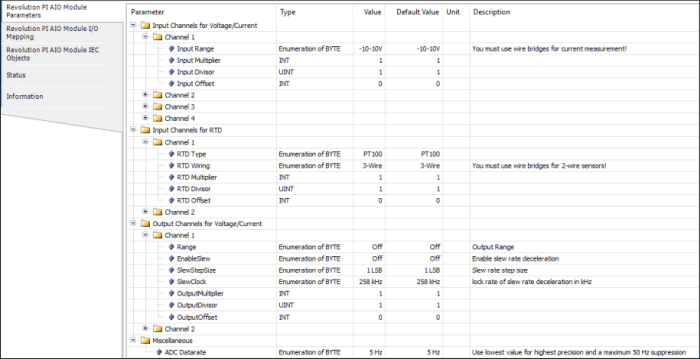
- Navigate to the first tab “Module Parameters”.
Your AIO has four analog inputs. These inputs can be set as either voltage or current inputs. Here you can connect sensors such as proximity or level sensors with analog outputs (typically 4-24 mA or 0-10 V). The maximum common mode voltage for all four inputs must not exceed 45 V.
For your configuration to work it is important that your devices are connected to the correct output pins.
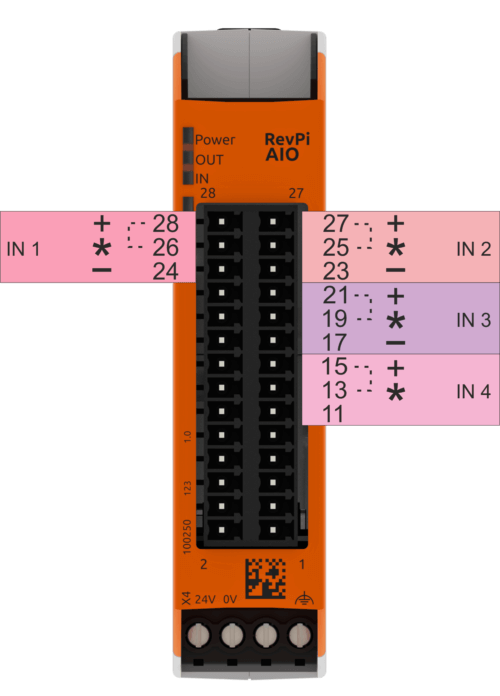
Input 1
|
Pin |
Application |
|
24 |
– negative input for current or voltage measurement channel 1 |
|
26 |
*a wire bridge must be installed for current measurements from here to pin 28 |
|
28 |
+ positive input for current or voltage measurement channel 1 |
Input 2
|
Pin |
Application |
|
23 |
– negative input for current or voltage measurement channel 2 |
|
25 |
*a wire bridge must be installed for current measurements from here to pin 27 |
|
27 |
+ positive input for current or voltage measurement channel 2 |
Input 3
|
Pin |
Application |
|
17 |
– negative input for current or voltage measurement channel 3 |
|
19 |
*a wire bridge must be installed for current measurements from here to pin 21 |
|
21 |
+ positive input for current or voltage measurement channel 3 |
Input 4
|
Pin |
Application |
|
11 |
– negative input for current or voltage measurement channel 4 |
|
13 |
*a wire bridge must be installed for current measurements from here to pin 15 |
|
15 |
+ positive input for current or voltage measurement channel 4 |
The detailed setting can be found in the following table: In the CODESYS AIO Module Parameters you need to click on the respective value tab. Then you can fill in the dropdown list with the configuration values.
|
Description |
Value |
Comment |
|
Input1Range, |
-10- 10 V |
Set the input range for voltage or current measurement here. The measuring method (current or voltage) as well as the range should match the output of the connected sensor. 0-10 V or 4-24 mA are typical for industrial sensors. |
|
ADC_DataRate |
5 Hz |
Set the frequency here, which is used as data rate at the analog converter. |
|
Scaling input 1-4: |
16 Bit signed Multiplier |
Here you can set a scaling for every output channel. It is determined by the three configuration values and calculated according to the following formula from the original value: (available in mV or µA respectively): Y = Multiplier/Divisor*X + Offset |
Please note that you can only output either current or voltage on one channel. For a current measurement a jumper, which you have to attach externally yourself, connects a load resistor (“shunt”) between the inputs for the voltage measurement. The modification of the ranges in PiCtory changes practically nothing in the measuring electronics, but is only used for the conversion to mV or µA and the monitoring of the threshold values. Only for the 0-5 V range the input sensitivity of the measuring amplifier is increased, so double accuracy is achieved in this range (maximum deviation in this range is 5 mV).
The scaling can subsequently be used for conversion in other units or for a subsequent calibration of a sensor. A 32-bit integer arithmetic is used for calculations in the AIO module. The results are then however stored as 16-bit values in the process image. Should the result Y exceed the limits of a 16-bit signed value, then the fault will be recognised and the value limited. The output values are always in the units mV or µA.
Example:
A proximity sensor outputs the voltage 0 to 10 V in the range between 30 and 300 millimeters. To have the distance in mm in the process image, you must select the parameters as follows:
Multiplier = 270, Divisor = 10000, Offset = 30
If the sensor works with 4-20 mA instead, the values must be defined by you as follows:
Multiplier = 270, Divisor = 16000, Offset = -38
About the ADC_DataRate:
The module uses a so-called delta-sigma converter of the type ADS 1248. This converter has an adjustable data rate, which is closely related to the frequency curve of the digital filter contained in such a converter. Detailed diagrams of the frequency responses obtained for each setting are given in the ADS 1248 data sheet on pages 31 and 32. Important for your measurements is here that low-frequency interfering signals, like for example a 50 Hz humming, can only be effectively suppressed at settings from 5 to 20 Hz. You will get the highest measurement accuracy with these settings. On the other hand, this reduces the update rate of the data values in the process image. The context is as follows:
|
ADC_Data rate |
Update rate in the P |
|---|---|
|
5 Hz |
1 Hz |
|
10 Hz |
2 Hz |
|
20 Hz |
4 Hz |
|
40 Hz |
8 Hz |
|
80 Hz |
10 Hz |
|
160 Hz |
25 Hz |
|
320 Hz |
max. 50 Hz |
|
640 Hz |
max. 125 Hz |
Please note that the table values for the 320 Hz and 640 Hz settings are maximum values only. The actual update rate achieved can be significantly lower in this area due to the load on the PiBridge. The load depends on your configuration and therefore the respective update rate for these ADC_DataRates can only be determined experimentally on your system and with your configuration. In general, these settings are therefore not recommended.
- Click on “File>Save”. This saves your file.
- Click on “Tools>Reset Driver”. This activates the changes for the adapter.
Should an error occur, you will receive error messages in the input values of the process image named InputStatus_1-4. The values have the following meanings:
|
Bit Position |
Status Message |
|
Bit 0 (LSB) |
0 = value is higher than the lower limit of the configured range 1 = value is at least 20 mV or 20 µA lower than the lower limit of the configured range |
|
Bit 1 |
0 = value is lower than the upper limit of the configured range 1 = value is at least 20 mV or 20 µA higher than the upper limit of the configured range |
In the field InputValue_1-4 you now see the actual value of the input. If you use the input as a voltage input, the value is given in mV. If you use the input as a current input, the value is given in µA.
In the fields InputValue_1-4 you can define symbolic names for the 4 analog input values. Under these names you can then read out measured values of the connected sensors from the process image with piTest, a self-written program or an application software. The values are given there for the voltage ranges in mV and for the current ranges in µA, if you have left the scaling at 1.